Tuesday, July 04, 2006

Social network of 911

Cooperative Research is a good resource for finding organized timelines for various important current events topics (e.g. Katrina, 911). In particular, the timelines are available in XML and easily parsed.

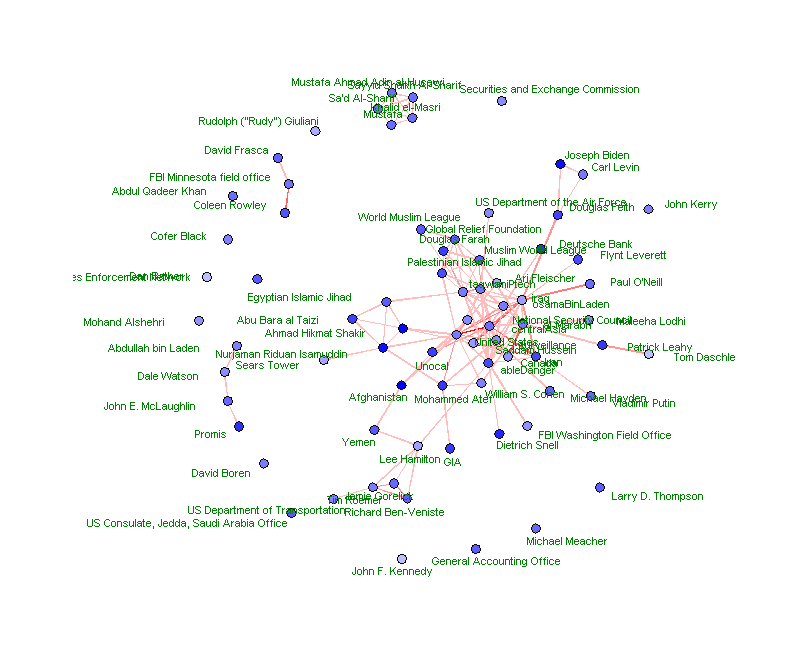
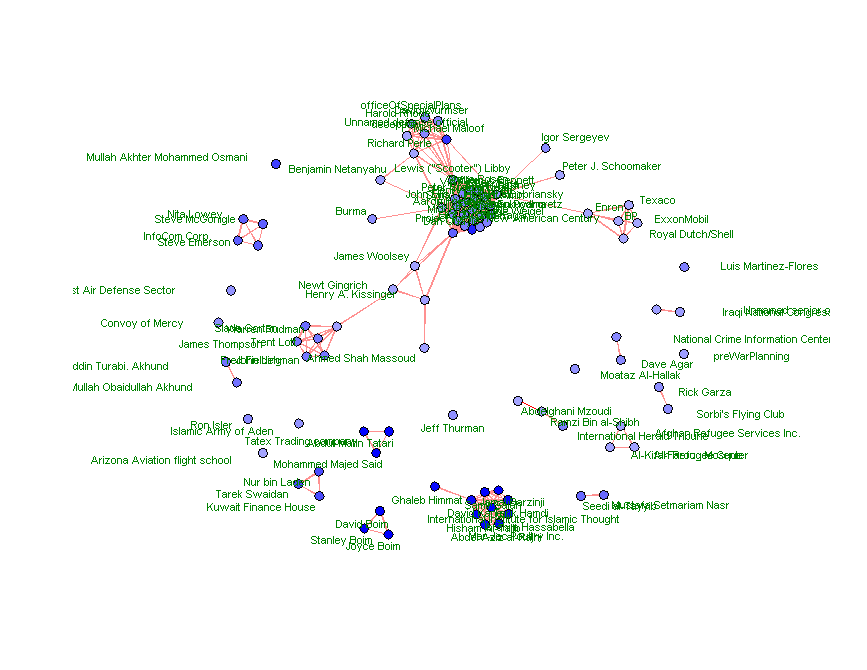
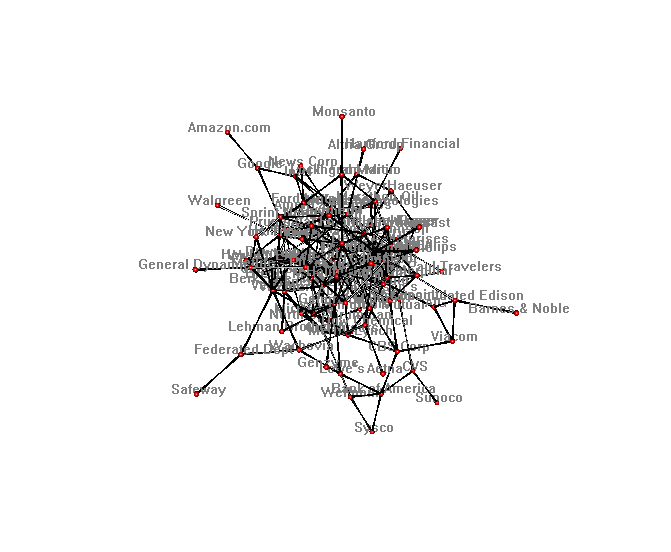
I was able to extract the timeline for 911 and, for each event in the timeline, the players involved in the event. Using the same network tools I've been using the other blog postings I've done recently, I have plotted the social network of the major entities involved.

For each picture, you can get a larger version by clicking on it. Note that a link means only that the two entities were involved in the same event(s), not that they necessarily acted together. Edge color represents the number of separate events in which the attached nodes were both involved, and vertex color represents the closeness score (for the first plot), the betweenness score (for plots 2 & 3) or the number of links (plots 4-6) for the entity.

Entities with top 75 closeness scores:

Entities with top 50 betweenness scores:

Entities with top 100 betweenness scores:

Entities with > 750 links:

Entities with > 500 links:

Entities with > 250 links:

Labels:

Blog mining

Study this!

Blogs Study May Provide Credible Information:
ARLINGTON, Va., June 29, 2006 – The Air Force Office of Scientific Research recently began funding a new research area that includes a study of blogs. Blog research may provide information analysts and warfighters with invaluable help in fighting the war on terrorism.

Dr. Brian E. Ulicny, senior scientist, and Dr. Mieczyslaw M. Kokar, president, Versatile Information Systems Inc., Framingham, Mass., will receive approximately $450,000 in funding for the 3-year project entitled “Automated Ontologically-Based Link Analysis of International Web Logs for the Timely Discovery of Relevant and Credible Information.”

“It can be challenging for information analysts to tell what’s important in blogs unless you analyze patterns,” Ulicny said.
See also this article from a few months ago, CIA mines 'rich' content from blogs:
President Bush and U.S. policy-makers are receiving more intelligence from open sources such as Internet blogs and foreign newspapers than they previously did, senior intelligence officials said.
Finally, cross-reference my article on social networks.

Labels:

Sunday, July 02, 2006

The purpose of a system is what it does

The purpose of a system is what it does. This principle, or POSIWID, was proposed by Anthony Stafford Beer, a luminary in operations research and management cybernetics, also known as systems theory. Although it is dangerous to use this principle to infer intent on the part of individual actors in a system, it is useful for analyzing the emergent behavior of a system. It certainly cuts through a lot of crap about unintended consequences.

If you don't know this already, I'm a big proponent of the idea of the egregore, the spirit-of-a-thing, the emergent personality of a system. If one wishes to know the "personality" of a system, that is, its egregore, then one simply observes what the system does: the purpose of a system is what it does.

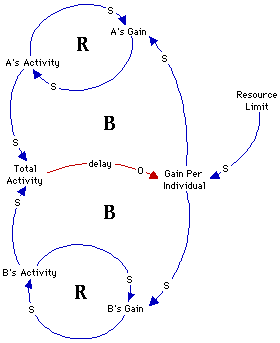
There is a site called Systems Thinking, which describes several archetypal examples of systems: Accidental Adversaries, Fixes that Fail, etc. One classic system is the Tragedy of the Commons , which also comes up in game theory (i.e. mathematical microeconomics) and is related to the Prisoner's Dilemma. The term "Tragedy of the Commons" derives originally from a parable published by William Forster Lloyd in his 1833 book on population:
The parable demonstrates how unrestricted access to a resource such as a pasture ultimately dooms the resource because of over-exploitation. This occurs because the benefits of exploitation accrue to individuals, while the costs of exploitation are distributed between all those exploiting the resource.
Let's look at some classical systems. One of the well-known dyanamical processes in evolutionary biology is the Lotka-Volterra system, also known as the system of predator-prey equations, proposed by Alfred J. Lotka in 1925 and Vito Volterra in 1926. Nowdays they are seen as over-simplistic, but they are sufficient to illustrate a point.

The prey are assumed to have an unlimited food supply, and to reproduce exponentially unless subject to predation. The predator population grows in proportion to the probability of a predator meeting a prey, and dies naturally at an otherwise constant rate. The solution depends upon the various rates and initial populations, but a typical solution to the equations looks like this:
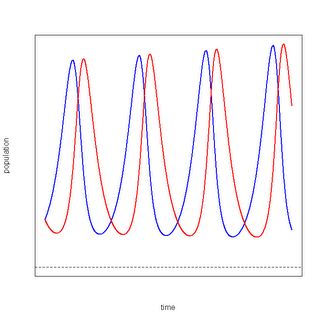
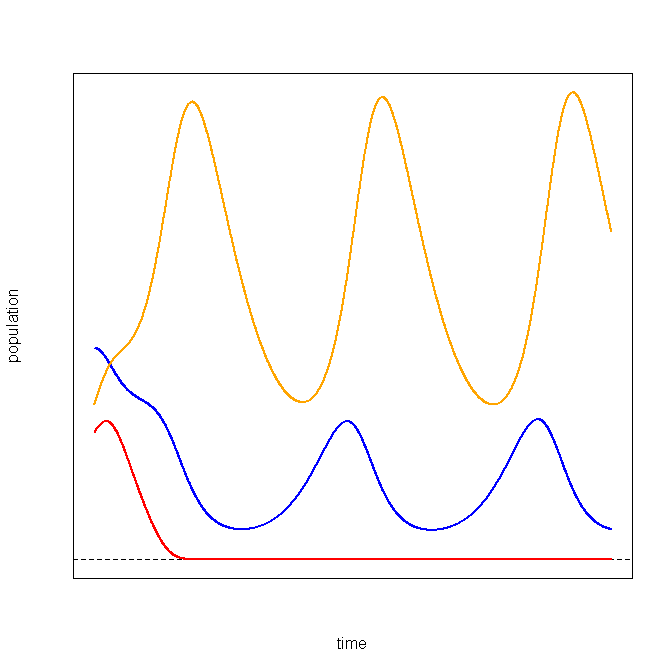
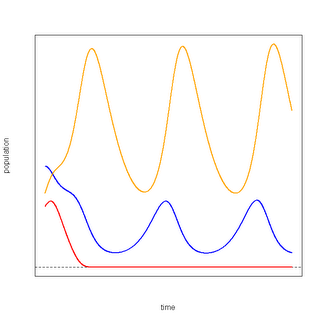
Here, blue represents the population of the prey and red represents the population of the predator. The populations oscillate over the course of time, with a spike in prey populations followed by a spike in predator populations. A system where there are two predators for the same prey has a solution that looks something like this (where orange represents the second predator):
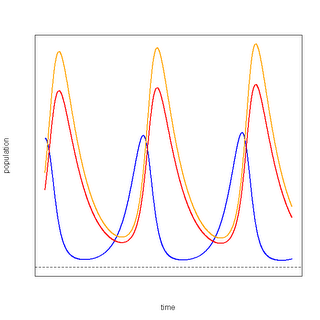
In a system where the competition between two predators intensifies when the prey is scarce, the solution depends on the relative initial populations of the predators and their relative degree of competition. When both predator populations are initially equal and both predators are equally competitive, the system oscillates until it reaches an equlibrium:
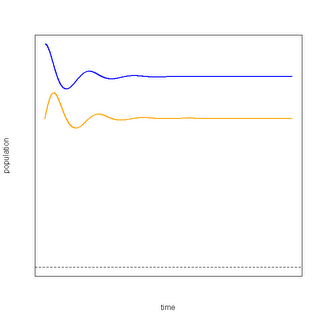
When the predators differ in initial population or in the degree of competitiveness, one of the predators can die out:
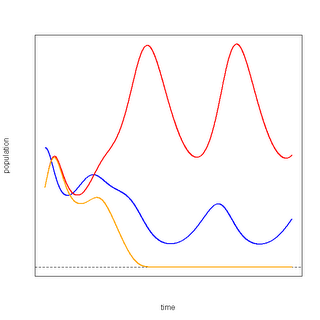

This is the mathematical intuition behind "survival of the fittest".

All of these systems are archetypal features of the "natural world". However, suppose the rate of prey consumption is large relative to the rate at which the prey replenishes itself. Then there will be a spike in the population of the predator(s), followed by a rapid decrease and re-equilibration:
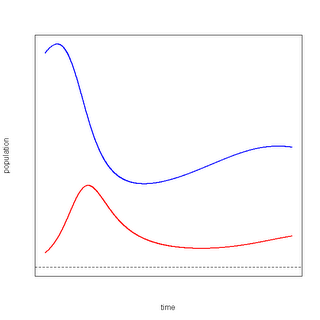

In the limit, when the "prey" cannot replenish itself (or represents a finite resource such as oil), then there will be a spike in population followed by a gradual die-off. One can think of this as the systems picture illustrating the Tragedy of the Commons:
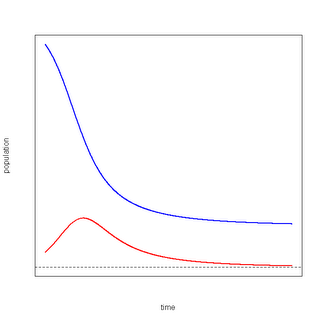
Note that the "resource" need not diminish completely to zero for the predator popluation to become extinct.

Now suppose there is a finite resource and that the intensity of competition between the two predators is inversely proportional to the amount of the resource left. The resulting system looks something like this:
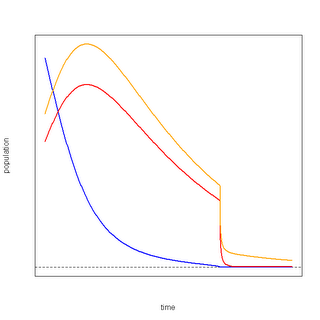
Note the precipitous die-off. The corresponding rate of decline for such a system looks like this:
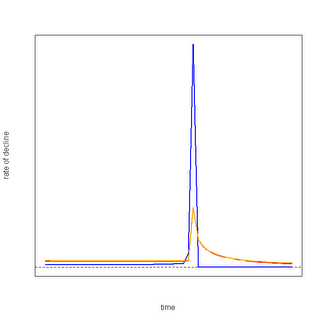
What this means is that there is a huge spike in resource consumption, followed by a corresponding spike in deaths of the predator(s).

The purpose of a system is what it does. In a system where actors are forced to compete for a common finite resource, and to compete more intensely as the resource disappears, the purpose is to kill off the actors in a bloodbath.

Any questions?

Labels:

Saturday, July 01, 2006

The sky is falling (....maybe)

Two stories that came up today:

Small asteroid to fly by Earth without danger
An asteroid will pass Earth at a very close distance in the predawn hours of Monday, astronomers reported on Friday, noting that there won't be any danger of collision.

The asteroid, coded 2004 XP14, was first picked up in December 2004. It is believed to be 370 to 800 meters in diameter, according to astronomers with the Near Earth Object Program (NEO) of U.S. space agency NASA.
Colorado Springs Air Force installation on heightened alert
An Air Force installation in Colorado Springs and one near Denver are operating with heightened security.

The Cheyenne Mountain Air Station, which houses NORAD, is now at "Bravo-Plus".

There are five levels of alert: normal, Alpha (low), Bravo (medium), Charlie (high) and Delta (critical). “Bravo-Plus” is slightly higher than a medium threat level.

Okay, so this may be an unfair juxtaposition. But in any case, I decided to do the Wikipedia network thingie I've been talking about. Below are two plots for the center of the network obtained by using the keywords Near-earth_object, NORAD, and Impact_event (45861 nodes and 131354 edges, pruned to 340 nodes and 12130 edges). The first shows the nodes that capture the upper 65% of the betweenness, the other captures the upper 80%. (The shading of the nodes is a new feature I introduced, representing the relative betweenness, darker colors representing higher betweenness scores.)


The appearance of May 12 in the middle of the network is easy to explain:
During the 2006 return to perihelion, which for the main fragment C takes place on 2006 June 6 (just inside the Earth’s orbit), the comet began to fragment into more than 30 additional pieces. All of the observed fragments in 2006 will pass relatively close to the Earth during the interval May 12 through May 28 but none will pass closer than 5.5 million miles. These passages of the fragments past the Earth offer astronomers an excellent opportunity to examine the cometary breakup process and hopefully these observations will shed some light on just why some comets disrupt. Apparently some comets have very weak internal structures and perhaps rapid rotation or the pressure of vaporizing interior ices, as the comet approaches the warming sun, causes these breakup events.
I couldn't find anything interesting about August 1 or September 12.

I'm treading here on Goro Adachi's territory, and I find myself wondering if this type of analysis can be used in the same way Goro uses his geodetic (and semiotic) analyses. Certainly, rather than becoming unhinged at the possibilities of various catastrophes, it's best to take Goro's dispassionate approach to the whole thing and try to learn what we can about the world and about ourselves.

For the record, I'm not pulling a Chicken Little/Cassandra here. I'm just pointing out two interesting stories and trying to see how memetic analysis can illuminate them.

Labels:

Friday, June 30, 2006

Memetic analysis of Apocalypse

Following up on the apocalypse meme, I decided to use some of the tools I've developed over the past week to conduct a "memetic analysis" of Apocalypse, at least from the English Wikipedia perspective.

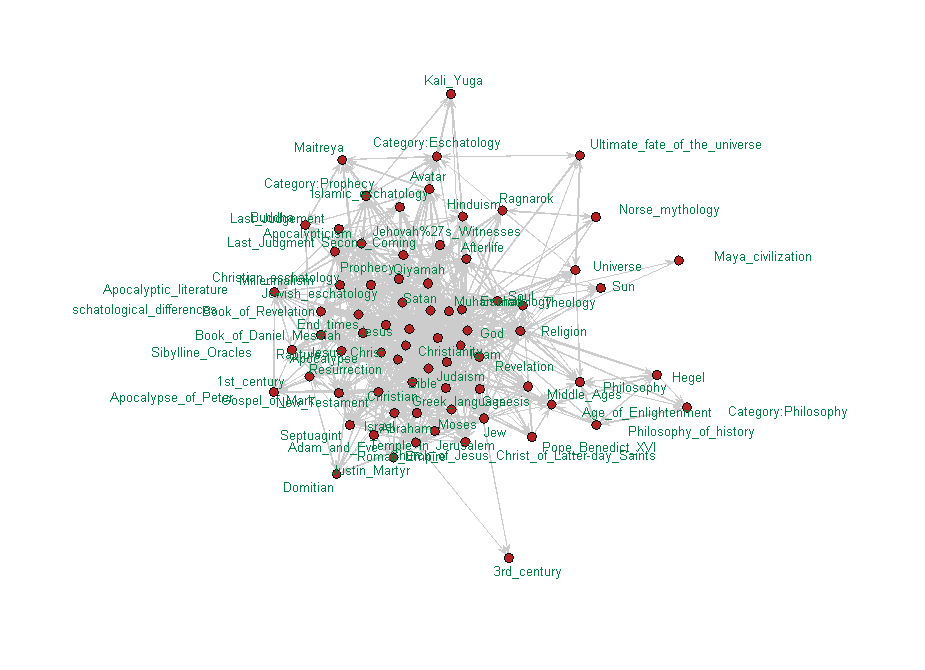
Starting at the Wikipedia entries for Apocalypse and Eschatology, I crawled down two levels on each Wikipedia link in the two base pages. The result was a network of 21,831 nodes and 51738 edges, impossible to analyze on my home computer. I culled the nodes that did not link back to any other node in the network, resulting in a smaller network with 266 nodes and 4406 edges: easy to analyze but hard to visualize. Therefore, I conducted a betweenness analysis for the smaller network, resulting in a number between 0 and 1 for each node, representing the extent to which the node serves as a "bridge" for a large number of paths between other nodes (1 being the most "between" and 0 being the least). Finally, used this betweenness measure to filter out the least important nodes in the network, varying a threshold until I obtained a visually digestible network image. Here is the result for a threshold of 0.01:

What emerges is that Apocalypse, at least as understood by English-speaking Wikipedia contributors, is overwhelmingly a Western concept, with Christianity, Jesus, Satan, God, etc. in the center of the network. There are a few nodes from Eastern religions on the outer edges of the network, notably Maitreya and Kali Yuga. Oddly, Maya civilization is included in the network, even though the Wikipedia entry does not seem to mention the associated 2012 eschatological speculations. The following figure shows the result of a higher threshold of 0.05, where it is clear that Jesus, God, Satan, and the Bible sit squarely in the middle of the network. So far, nothing too surprising.

Next, I added a Wikipedia page Peak oil, once again traveling down two levels on each link. The result was a network of 74,726 nodes and 30,714 edges. Using the same strategies to cull the data to obtain a visually digestible network image, here is the result:

Clearly Apocalypse and Peak oil separate into largely distinct clusters. What is interesting is what lies in the middle: United States, Sun, Canada, Israel, and Venezuela (and to some extent Doomsday). Note that Pope Benedict XVI now emerges as a bridging node. Readers familiar with Christian apocalyptic thinking will no doubt recognize Israel as a key player (and perhaps Benedict also). Note that Transhumanism and Technological singularity are also in the center.

Finally, I included Global warming, using the same methodology as described above. The result:

With the addition, the clusters seem to merge a bit, with Global warming and Peak oil on one side, Christian apocalyptic thinking on the other, and numerous countries sitting in the middle of the network. Note that George W. Bush and Pope Benedict XVI appear to be the only living persons sitting in the middle of the network.

The results of this analysis highlight which countries and present day personalities are central to the joint themes of Apocalypse, Peak oil, and Global warming. Predictable players emerge as nodes in the network, including one (Maya civilization) that seems to have no explicit mention of apocalypse eschatology in the main page. The results also shows how some of the other millenialist themes of Transhumanism and the Technological singularity travel along as companion memes.

Labels:

Apocalyptic Thinking

My post at Round Earth League, Sustainability vs. Apocalypse, generated a little discussion between Wally and myself. He reacted rather negatively to a quotation by Ran Prieur, who can admittedly be heavy-handed and difficult to accept out of context. There is this idea in some corners of the internet that we are on the verge of an energy apocalypse (i.e. the whole peak oil / global warming thing), and Ran sees this somewhat as an opportunity to shed some collective baggage, i.e. the power asymmetries that have emerged and intensified with fossil fuels and the technologies they enable. I quoted Ran in my post a couple of weeks ago, South Central Farm, where he rather succinctly lays out the power dynamic that predestined the outcome there. While I don't necessarily agree with Ran on the likely long-term outcomes (or even necessarily the desired outcomes), I think he's pretty good at describing our present situation.

The fact is that there are very powerful and pernicious forces that would make people utterly dependent upon them, and have the firepower to enforce their desires. When food becomes a serious issue because of (1) global climate change and (2) the lack of petroleum for fertilizers, this will come to a head. Tonight I read a story posted via Heretic Fig that serves as an example:
New Delhi, May 8 - The Uttar Pradesh government was conducting raids on farmers for stocking up their own wheat produce, environmental activist Vandana Shiva and Bharat Krishak Samaj executive director Krishan Bir Chowdhary alleged Monday.

They assailed the double standards of the authorities for taking no action against multinational and private companies like Cargil, ITC and PepsiCo for buying wheat in large quantities even as the government was seeking to import 3.5 million tonnes of wheat to meet its buffer stock norms and public distribution system supplies.

While the government seemed reluctant to buy wheat stock from farmers at prices higher than Rs.650 per quintal, it was proposing to import stock at prices over Rs.950 per quintal.
Ran's position, not necessarily mine, is that things will take care of themselves in the very long run: lack of fossil fuels means that eventually all the terrible firepower will go away, or at least the transportation capabilities that makes it easy to deploy over a large geographical range. I don't think that's necessarily the case, since there is always nuclear power available to people who know how to use it and have the will to do so.

My personal belief is that it is important to develop sustainable technologies and also a sustainable food supply. It's also important to consider architectural changes, i.e. construct communities that are close to food supplies and do not require automobiles for daily life. That stuff is a no-brainer: we have to do it.

The real difficulty is how to deal with the political problem of power. As Wally suggests in our discussion, power and its enforcing structures are here to stay, and any disruptions would make things much worse in the short run (meaning our lifetimes). Katrina is a perfect example of this.

My only solution, at the moment, is to try to make people at least aware of the problem. If enough people have their antennae up about it, cultural solutions may emerge.

A separate issue is why people gravitate towards apocalyptic thinking. Apocalyptic scenarios are ultimately unproductive: you can never prepare for an apocalypse and expecting one only saps your productive energy. But I understand why some people gravitate towards this meme, and while I despise the violent apocalyptic frames of Christianity, I have sympathy for the people who are looking to them as a release from the pain of living in a world that is becoming increasingly difficult to negotiate. I think many (if not most?) people intuit the power asymmetry I'm talking about, sense that something is about to change, and fear the ramifications. Apocalyptic Christianity (or apocalyptic environmentalism) is a cognitive strategy some people use to grapple with it.

When looking to the future, we need to consider the meaning of this.

Labels:

Wednesday, June 28, 2006

WikiMemes!

I've been playing around with network algorithms, trying to find a way to use them to illuminate memetic research. I've discovered that Wikipedia is a great resource for this kind of "computational memetics". Wikipedia does have its flaws, but it is a continuously updated network of concepts with a regular data format that can easily and quickly be accessed and processed.

It's remarkably simple: you pick a topic (or several) and find the corresponding Wikipedia entries. Then you crawl down the links a predeterimed number of levels, record the linkages, and finally visualize them. In order to do this efficiently there are some technical computer-science issues to deal with, but conceptually that's all there is to it.

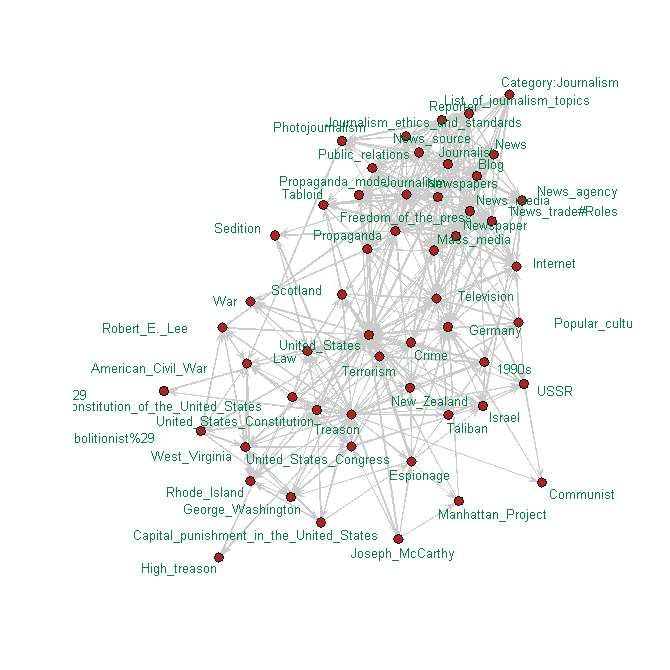
My most recent posts addressed (1) organic certification and (2) treason and journalism. The following pictures show you the Wikipedia neighborhood of these two concepts.


For the network that visualizes organic certification, the base-level keywords were Organic_certification, Organic_food, and Sustainable_agriculture. The network shows a cluster involving business and legal issues and another involving organic farming methods. For the network that visualizes treason and journalism, I used both words as base-level keywords. Words like terrorism and sedition appear in the center of the network.

I've also shown a network for Panopticon, which comes up with 1984, Big Brother, and surveillance.

It will be interesting to see how far I can push this. In particular, I'd like to come up with a useful ways to uncover "hidden" memes and track meme-creep.

Labels:

Tuesday, June 27, 2006

Joint social networks of media and defense

Following up my post on media giants and their relationships via interlocking directorates, in this post I'll look at the connections between media giants and major defense contractors. I was surpised to find that there are few (if any) direct connections. The major defense contractors most connected to media giants seem to be Honeywell and Northrop Grumman. Honeywell has a 2nd degree connection to CBS via Merril Lynch, a 2nd degree connection to Disney via Edison International, and a 2nd degree connection to GE via Verizon. Northrop Grumman is connected to GE via Deere and Chevron, to Disney via Washington Mutual, and to CBS via Merrill Lynch.


Haliburton and Raytheon are connected to Time via Citigroup. Lockheed is connected to News Corp via Ford Motor, and to Time via Dell. (Note that News corp is relatively isolated from the other media giants.)


At this point, I think it would be more enlightening to focus on individual directors and their biographies, to see if there is anything there. Let me know if you have any ideas.

Labels:

Sunday, June 25, 2006

The social lives of media giants

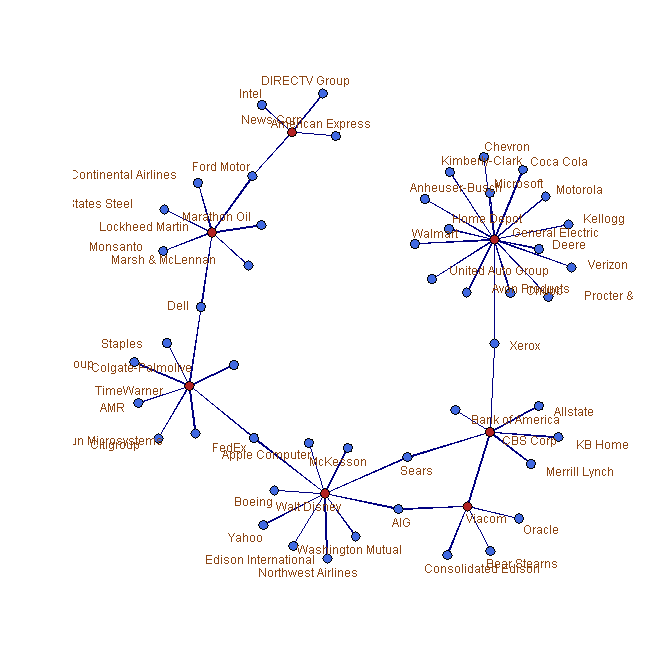
Following up from my last post about social networks and interlocking directorates of corporations, I now have the top 300 companies in my database (minus 15 companies that are not publicly traded and plus 17 other companies of interest, for a total of 302 companies). The top five "bridging" companies are Citigroup, Pepsico, AMR (American Airlines), Target, and GE, with betweenness measures of 2582, 2151, 1540, 1390, and 1349, respectively.

This post illustrates the social neighborhoods of media giants, defined (as previously) by interlocking directorates.
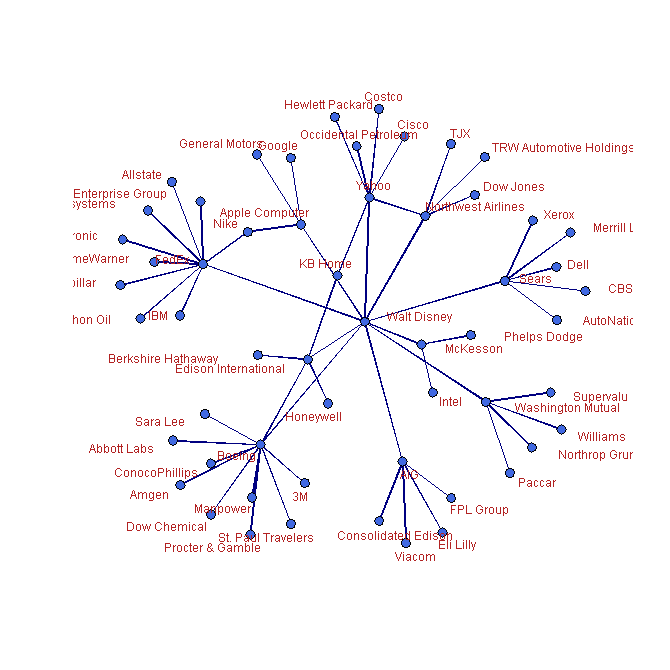
The first graph shows the social neighborhood of NewsCorp (Rupert Murdoch's spawn), taken out to two degrees of separation from NewsCorp. Note the direct connections to Ford and Amex.

The next graph shows the 2-degree social neighborhood of Disney.


This one shows CBS.


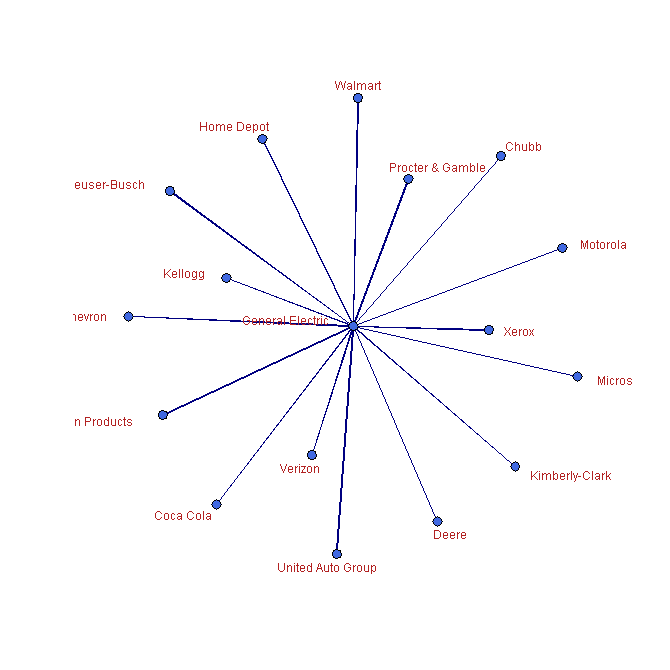
General Electric and TimeWarner have complicated 2-degree neighborhoods, so I'm only showing 1 degree for each. In particular, TimeWarner is connected to CitiGroup, which is hugely connected.


Finally, here's Viacom, the apparently shy media giant (although note the connection to CBS).

The betweenness measures of these companies are 1349 (GE), 580 (Disney), 359 (TimeWarner), 321 (CBS), 122 (Viacom), and 27 (News Corp).

What should we learn from this? Well, it doesn't seem like there's any overall general pattern in terms of cross-memberships on boards, other than that a couple media giants are well-connected. However, I think these figures are a useful reference for suggesting how a particular media message may be slanted. For example, we might be alert to the subtexts of media products produced by NBC, Universal Pictures, Universal Studios, Focus Features, Rogue Pictures, MSNBC.com, msn,com, and NBC.com, all subsidiaries of GE.

This has been an interesting exercise, and I hope to conduct similar analyses of defense contractors, energy companies, pharmaceutical companies, and food companies.

Labels:

Saturday, June 24, 2006

Social networks of corporate citizens


The name of this blog, Memetix, reflects my interest in the propagation of memes1. A related idea is that of social networks, about which much theoretical material has been written. Memes propagate from node to node (person to person) along the “edges” (technical term for links between people) of the network, and spread faster if they hit a node which is “central” in some sense.

As you can imagine, sociologists are quite interested in social networks. However, the study of social networks is also a big deal in business circles. A recent Wharton Business School article describes how and why companies are becoming interested in studying social networks:

Mapping social networks can be useful in many ways, but [Wharton management professor] Rosenkopf says there are at least two reasons why corporate interest in the subject is growing: Companies want to be able to identify key performers and get a better understanding of the nature of the interaction among employees.

"Hopefully, you have organized your company the best way to get the job done," she says. "But mapping out a network will give you a sense of whether actual work flow and communication flow match what you hope to achieve. Maybe there are bottlenecks where one person is managing all interactions. If you expect two groups to work together closely, and you don't see them doing this, you might want to create liaison roles or other relationships to make information flow better. On the other hand, you may see groups talking to each other too much. When managers see network diagrams, they often realize they need to reconfigure their organizational chart."

The internet is a gigantic social network, and has been studied by Albert-Laszlo Barabasi, an important mathematician. An MIT researcher, C. Marlow, is interested in studying how news travels through the blogosphere:

We have constructed a system to track memes within the weblog community. As a meme diffuses through social ties, our system documents the time and location for each posting that is observed. Based on these data, webloggers can be categorized by their adoption characteristics, ranging from early- to late-adopters.

Yes, dear friends, you are being studied.

I am starting to learn some of the techniques used by social network theorists. As an example (which has its own semi-enlightening results), in this article I will present a preliminary analysis of the network formed by our “corporate citizens”. As UCSC sociology professor G. William Domhoff states,

Interlocking directorates -- defined as the linkages among corporations created by individuals who sit on two or more corporate boards -- have been a source of research attention since the Progressive Era at the turn of the 20th century, when they were used by famous muckraking journalists, and future Supreme Court Justice Louis Brandeis, to claim that a few large commercial and investment banks controlled most major corporations.

Drawing inspiration from the site They Rule, which provides a graphical tool for researching corporate board memberships and interlocking directorates, I consider two corporations to be linked if they share a board member (or if an officer in one company sits on the board of another). Unfortunately, the data at They Rule is from 2004 and not available in a format necessary for social network analysis. Consequently, I spent the day downloading board information from Reuters. The data used for this analysis consists of the top 100 companies (in gross revenue), minus six companies for which data were difficult to obtain and including an additional 27 companies that are involved in defense, media, or pharmaceuticals. Clearly the 27 extra companies reflect the bias of my own personal interests. Eventually I plan to expand the analysis.

A few screen shots of the network (excluding isolated companies) appear above. Table 1 below shows the non-isolated companies, sorted by centrality degree (number of ties to other companies) and showing betweenness (how much of a bridge the company is) and closeness (how close the company is to others in the network). Unsurprisingly, Citigroup is a huge bridge and very linked, while General Electric, Verizon, and Honeywell are well-linked and represent bridges in the network. Oddly, Pepsico and Target are at the top of the table as well.

A statistical test for betweenness produces a significant P-value (~0.01), demonstrating that this network is more centralized by betweenness than the typical random network of the same size and density, i.e. there are a few key corporations. The corresponding test for degree centrality not significant (with respect to network size, P~0.6), indicating that this network is typical in terms of linkage when compared with other networks of its size.

Thus, it would appear that this social network of corporate citizens seems to have a very large conduit of corporate governance memes in the form of Citibank and perhaps few other companies. It is interesting to compare the results to Domhoff's article, where he uses Citibank as an example, and to the statistics mentioned in this 2002 USA Today article.

This is a work in progress. Please let me know if you have comments, any interesting ideas (or you would like to help download Reuters data!!)

1Thought of more informally than in the most technical academic sense.


Table 1: Social Network Measures for Individual Companies


Centrality

Between

Close


Centrality

Between

Close

Company

Degree

ness

ness

Company

Degree

ness

ness

Citigroup

34

1089

0.42

Dow Chemical

8

182

0.34

General Electric

20

455

0.38

Edison International

8

102

0.32

Pepsico

20

435

0.38

General Motors

8

52

0.33

Verizon

20

471

0.37

Hewlett Packard

8

74

0.31

Honeywell

18

337

0.35

Lockheed Martin

8

126

0.30

Target

18

400

0.38

New York Times

8

48

0.32

Du Pont

16

169

0.35

Northrop Grumman

8

65

0.30

Pfizer

16

123

0.34

Sears

8

112

0.31

Procter & Gamble

16

262

0.37

United Parcel

8

109

0.32

Walt Disney

16

322

0.33

Wachovia

8

123

0.32

Boeing

14

191

0.34

Yahoo

8

108

0.31

Chubb

14

261

0.34

ADP

6

58

0.33

Coca Cola

14

159

0.35

AIG

6

38

0.28

ConocoPhillips

14

183

0.36

Albertson's

6

27

0.27

Dell

14

166

0.34

CVS

6

129

0.25

Exxon

14

137

0.34

Federated Dept

6

102

0.28

Ford Motor

14

296

0.35

Google

6

114

0.27

Goldman Sachs

14

130

0.34

International Paper

6

22

0.31

IBM

14

236

0.35

Kroger

6

39

0.30

United Technologies

14

262

0.36

Lowe's

6

131

0.31

American Express

12

187

0.34

Merck

6

19

0.31

Bristol Myers Squibb

12

189

0.37

News Corp

6

5

0.30

Deere

12

135

0.35

TimeWarner

6

46

0.33

Dow Jones

12

111

0.34

United Health

6

21

0.31

FedEx

12

123

0.33

Viacom

6

38

0.28

Home Depot

12

241

0.34

Wellpoint

6

61

0.27

Merrill Lynch

12

147

0.32

WeyerHaeuser

6

29

0.28

Metlife

12

123

0.31

Wyeth

6

5

0.31

Motorola

12

127

0.36

Borders

4

15

0.26

Sprint Nextel

12

68

0.32

Calpine

4

0

0.30

Walmart

12

138

0.34

Costco

4

5

0.26

Wells Fargo

12

241

0.35

HCA

4

0

0.31

Abbott Labs

10

87

0.35

Ingram Micro

4

19

0.27

Alcoa

10

64

0.34

Lehman Brothers

4

8

0.30

Allstate

10

92

0.32

McKesson

4

29

0.28

AT&T

10

87

0.30

Raytheon

4

14

0.31

Bank of America

10

192

0.28

St. Paul Travelers

4

0

0.28

Cardinal Health

10

114

0.32

Sysco

4

0

0.23

CBS Corp

10

166

0.30

Washington Mutual

4

19

0.27

Chevron

10

152

0.32

Aetna

2

0

0.25

Cisco

10

210

0.34

Altria Group

2

0

0.26

Haliburton

10

84

0.35

Amazon.com

2

0

0.21

Intel

10

130

0.31

Barnes & Noble

2

0

0.24

Johnson & Johnson

10

117

0.34

Coca-Cola Bottling

2

0

0.24

Marathon Oil

10

99

0.34

Comcast

2

0

0.30

Microsoft

10

92

0.34

General Dynamics

2

0

0.24

Prudential Financial

10

70

0.33

Genzyme

2

0

0.27

Berkshire Hathaway

8

77

0.30

Hartford Financial

2

0

0.27

Caterpillar

8

18

0.30

Monsanto

2

0

0.23

Choicepoint

8

139

0.29

Safeway

2

0

0.22

Coca-Cola Enterprises

8

25

0.32

Sunoco

2

0

0.20

Consolidated Edison

8

199

0.32

Walgreen

2

0

0.26


Labels: