WikiMemes!
I've been playing around with network algorithms, trying to find a way to use them to illuminate memetic research. I've discovered that Wikipedia is a great resource for this kind of "computational memetics". Wikipedia does have its flaws, but it is a continuously updated network of concepts with a regular data format that can easily and quickly be accessed and processed.
It's remarkably simple: you pick a topic (or several) and find the corresponding Wikipedia entries. Then you crawl down the links a predeterimed number of levels, record the linkages, and finally visualize them. In order to do this efficiently there are some technical computer-science issues to deal with, but conceptually that's all there is to it.
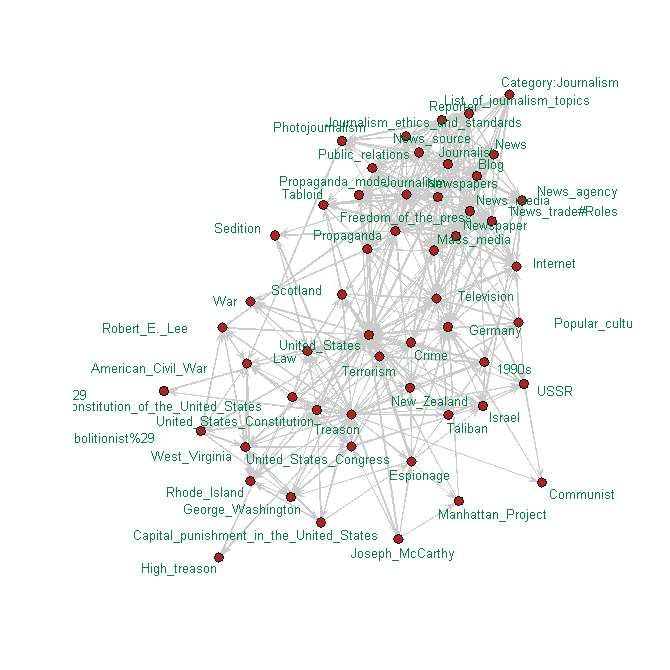
My most recent posts addressed (1) organic certification and (2) treason and journalism. The following pictures show you the Wikipedia neighborhood of these two concepts.
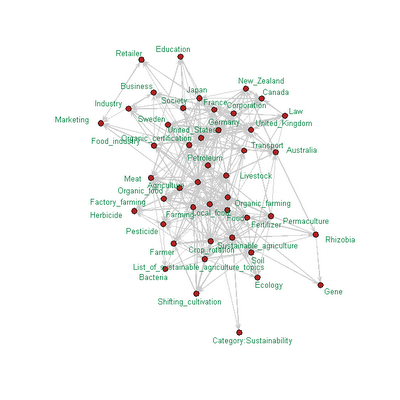

For the network that visualizes organic certification, the base-level keywords were Organic_certification, Organic_food, and Sustainable_agriculture. The network shows a cluster involving business and legal issues and another involving organic farming methods. For the network that visualizes treason and journalism, I used both words as base-level keywords. Words like terrorism and sedition appear in the center of the network.
I've also shown a network for Panopticon, which comes up with 1984, Big Brother, and surveillance.

It will be interesting to see how far I can push this. In particular, I'd like to come up with a useful ways to uncover "hidden" memes and track meme-creep.
It's remarkably simple: you pick a topic (or several) and find the corresponding Wikipedia entries. Then you crawl down the links a predeterimed number of levels, record the linkages, and finally visualize them. In order to do this efficiently there are some technical computer-science issues to deal with, but conceptually that's all there is to it.
My most recent posts addressed (1) organic certification and (2) treason and journalism. The following pictures show you the Wikipedia neighborhood of these two concepts.

For the network that visualizes organic certification, the base-level keywords were Organic_certification, Organic_food, and Sustainable_agriculture. The network shows a cluster involving business and legal issues and another involving organic farming methods. For the network that visualizes treason and journalism, I used both words as base-level keywords. Words like terrorism and sedition appear in the center of the network.
I've also shown a network for Panopticon, which comes up with 1984, Big Brother, and surveillance.

It will be interesting to see how far I can push this. In particular, I'd like to come up with a useful ways to uncover "hidden" memes and track meme-creep.
Labels: experimental
posted by slomo at 5:57 PM
![]()

2 Comments:
This is really interesting. Are the line lengths dependent on anything? One would imagine these networks could be visualized in an infinite number of ways, depending on the rules.
The line lengths are essentially meaningless, although they are obtained from an algorithm that attempts to place the nodes in such a way that nodes that are "more connected" are closer together. [Specifically, I'm using the algorithm of Fruchterman and Reingold (1991), implemented in the 'sna' package of the R statistical program.] There are indeed infinitely many ways to visualize the nodes. Even with the F&R algorithm there are infinitely many vantage points from which to view the network. I always choose one where the labels are most legible (after trying several).
Post a Comment
<< Home